
Market Commentary
Wesley Chapel, FL
“The best way to minimize risk is to think.”
There is really nothing secret, or proprietary about what we do at Elevate. I have always said that I would share our entire portfolio management framework with anyone who wants to know. I didn’t develop it alone, and I am certainly not the only one who knows how to do it. In fact, most of the best investors who have ever lived have been sharing these “secrets” basically for free, for longer than I have been around. I am merely a very short man standing on the shoulders of giants in this respect.
People hire us not because of any magic tricks, but because of our intense discipline. Our commitment to following the process consistently—day after day, week after week, month after month, year after year—through all types of market environments and crises, without emotion and without compromise, is what sets us apart.
We don’t get “FOMO,” and we don’t panic.
We wake up early, we go home late. Figuratively speaking.
We can’t guarantee our success but work very hard to deserve it.
And sometimes, the market makes us feel just a bit like the image to the right! (joking of course, but this was too funny not to share...)
Abraham Lincoln (I think) said: “Discipline means choosing between what you want now and what you want most.”
Discipline also shares the same Latin root as disciple. And I am disciple of Jesus Christ. Although, if I am being honest, I follow our portfolio management process more perfectly than I follow Jesus, despite my best efforts as a fallen creature. I will spend the rest of my life getting better at both.
Last month, I said:
Let's just get this out of the way early. I still think we are operating in the mother of all bubbles, as we have been for years. Not even during the 2022 bear market or the COVID crash in 2020 did the market drop to its average price, as measured by Warren Buffett's preferred indicator: total stock market capitalization as a percentage of GDP. In fact, the last time stocks traded at their average valuation in the past 25 years was in 2015 – a decade ago.
As I have said before, what is the only responsible thing to do in a bubble? Buy stocks and use trailing stops.
How much of which stocks, and how tight or wide to set the stops, are important questions. I plan to cover that next month.
So, here we are. Still in the mother of all bubbles if you ask me… but this month I want to focus on two aspects that I would want to know if our roles were reversed: “how much” to invest and “how tight or wide to set the stops.”
Remember that earlier this year (here and here) I essentially covered the “which stocks” aspect. So, you may want to check those out if you missed them or want a refresher.
For your convenience, here is a brief recap.
We start with a screener. This filters down the available universe of investments to just a few of the highest quality businesses in the world.
Then we conduct fundamental analysis using several methods on the most compelling businesses on the list to determine a fair price to pay. Most of the best businesses generally trade well above their fair value. So, we set alerts to be notified when a great business falls to a price that we consider fair.
Once a business is trading at a fair price, we apply technical analysis using quantitative methods and various timeframes to identify high probability entry points.
Sometimes, we are just looking for momentum and we basically skip the fundamental and technical analysis and just buy stocks that are going up and hold them until they stop going up.
Regardless of the approach we take, we consistently apply the same basic risk management strategies. In fact, I am going to show you how much of pretty much any investment to buy in three easy steps. Hang with me!
There is a big difference between most retail investors and the best professional investors in the world, and it has to do with the focus. Retail investors almost always focus on how much money they can make on a trade if everything works out perfectly. In contrast, the best investors in the world almost always focus on how much they can lose on a trade.
The best investors never risk a penny more than they are willing and they understand that the returns are out of their control.
I am no different. And again, I didn’t figure this out for myself. I copied it from the best of the best. I cannot know which investment will be my best in advance. If I did, well, of course I would only buy those. What I do instead is eliminate losers as quickly as possible – and what I am left with are winners.
The first step to risk management is determining the amount of money you are willing to lose, or risk, on one investment. This is usually done as a percentage of your overall portfolio, but can also be stated as a specific dollar amount.
For my purposes today, let’s say you are willing to lose 2% of your portfolio on one investment. We’ll call this the “portfolio risk.” Why 2%? Well, it is really a matter of preference. The principle behind it is that you’d basically have to lose 2% on 50 consecutive investments to lose 100% of your money. You could be more conservative by risking only 1% per investment, or more aggressive by risking 4% per investment.
There is no one-size-fits-all approach. And you don’t have to stick with the same amount for every investment. If you are more confident in one investment, you might risk more, and for more speculative positions, you might risk less.
The second step is to determine the exit strategy. Most investors, including professionals, never give even a moment of consideration to when they will exit. And they end up holding losers for way longer than they should. Ironically enough, they also end up selling winners too soon.
Screenshot from Ronin (Frankenheimer, 1998)
Defining your exit strategy generally involves some type of stop loss, or a price at which you’ll exit the trade. Doing this gives you a way to determine the exact amount you are risking.
There are different types of stop losses. Let’s just start with some basic definitions:
Stop Loss: An order to sell a security once it reaches a specified price, intended to limit potential losses on a position.
Hard Stop Loss: A fixed, non-negotiable price or percentage level at which a position will be closed if reached, regardless of market conditions.
For example, a price-based hard stop would be selling if the price closed below $100, and a percentage-based hard stop would be selling if the price closed 25% below your cost basis.
Trailing Stop Loss: A dynamic stop that adjusts automatically as the security’s price moves in your favor, maintaining a set percentage or dollar amount below its highest price.
Choosing the percentage to use for a trailing stop loss should be based on the historically normal behavior of the security.
For example, if a stock has fallen by an average of 20% every year for the past few years, despite rising 100% over that time, you would want to use a percentage greater than 20% so that you don’t lose your position for the longer run just because it drops 20%, which is normal for that stock.
After deciding how much capital you are going to risk, and which exit strategy you are going to use, you can easily complete the third step: calculate your maximum position size.
Let’s say you are willing to risk 2% of your portfolio in a position, and you have decided to follow a 25% trailing stop.
To find the maximum percentage allocation to this position, simply divide the portfolio risk (2%) by the stop percentage (25%).
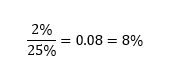
So, you could invest a maximum of 8% of your portfolio into the position. If the position dropped by 25% the most you’d lose would be 2% of the portfolio.
Let’s look at it through an example.
Let’s say your portfolio is worth $1,000,000 and you want to figure out how many shares of ABC stock to buy, with shares trading at $50.
First, you’ve decided that you are willing to risk 2% of your portfolio, or $20,000, on this investment.
Next, you’ve decided that a 25% trailing stop is the right exit strategy.
Now, you can calculate the maximum number of shares you should buy.
One way is to just apply the answer from the calculation above to your $1,000,000 portfolio.
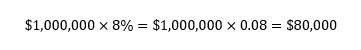
Then you calculate the number of shares.
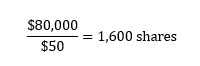
So, you could buy 1,600 shares at $50/share.
Or you can use dollar amounts to get there a little more quickly.
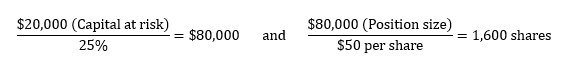
It’s pretty straightforward.
Just because you can, doesn’t mean you should.
Now for some nuance. Remember, what we are calculating is the maximum position size. You don’t have to invest the full amount you calculated. And I usually don’t.
Here is why.
Just because I am using a stop loss of 25% doesn’t mean that my exit order will be executed at exactly the right price.
I never enter stop orders with my broker because doing so would reveal to everyone in the market that I am willing to sell my shares at that price. It would be a lot like playing poker with all my cards showing.
Another reason I don’t enter my orders into the market is that during the trading day, prices can swing wildly, only to close for the day near the same price they opened. For example, during the flash crash on May 6, 2010, boring old Procter & Gamble (PG) stock dropped around 30% in a matter of minutes, only to close basically flat for the day. That would have cost you big time if you had a 25% stop loss order entered.
Instead of entering my orders into the market through my broker, I set alerts that I receive via text message or email based on the closing price at the end of the day. Because prices can move well past my stop level by the end of any trading day, there is always a risk of “slippage.”
Slippage: The difference between the expected price of a trade and the actual price at which it is executed. Slippage typically occurs during periods of high volatility or low liquidity and can result in higher costs or reduced returns for the investor.
I want to come back to something I mentioned above where I wrote, “You could be more conservative by risking only 1% per investment, or more aggressive by risking 4% per investment.”
This concept is called risk budgeting.
Risk Budgeting: A portfolio management approach that allocates risk rather than capital, across investments to achieve a desired overall risk profile.
I use risk budgeting in managing your portfolio at Elevate. And I do it on a couple of levels. First, based on your willingness and ability to take risk, we categorize you as Conservative, Moderate, Growth, or Aggressive, and assign a standard portfolio risk to each category, with Aggressive being the highest.
So, for example, I might be willing to risk 2% of portfolios in the Aggressive category, but only 1.5% of portfolios in the Conservative category on the same position. And even within the Aggressive category, there might be a highly speculative position that I am only willing to risk 1% on. In that case, I wouldn’t be willing to risk anything in that position for a portfolio in the Conservative category.
Note that risk budgeting and trailing stop losses can be applied to define risk even in momentum strategies where no fundamental analysis is being carried out, and we are not buying a high-quality business. Maybe we are even buying an outright crappy business. Sometimes the market doesn’t care about fundamentals, as noted in last month’s commentary, the Goldman Sachs basket of Profitless Technology stocks has been leading the market rally since mid-April.
And even beyond that, sometimes we are speculating over the long term on a stock that we simply don’t want to get stopped out of at any price, and so we are effectively willing to risk 100% of our investment in that position. Think of things like gene editing, space travel, or online sports books. In such cases, if our max portfolio risk is 1%, then we can invest a maximum of 1% in that position. That makes the (already pretty easy) math even easier.
That’s really all there is to it. Again, none of it is complex mathematics or analysis. Effective risk management, and therefore portfolio management, boils down to intense discipline and a little bit of hard work. Many people, including many financial advisors, either can’t or don’t want to do one or both, and that’s where we come in!
Let’s check in on performance this year and last month.
Can you believe it? Gold is on fire! It was up 4.8% last month, trouncing all the stock indexes again, and it is now up 31.4% in 2025. Guess what our biggest holding is, as a firm? That’s right. Gold!
Last month, I highlighted the technical situation in gold and I pointed out that it was forming a consolidation pattern known as an ascending triangle, a bullish pattern, and would likely break out to the upside, which it did decisively. Here is an update of that chart.
The second-best performing index year-to-date is the Top 10 index. That is the ten largest companies by market capitalization in the S&P 500, weighted equally. These ten stocks now make up almost 40% of the S&P 500. The two largest stocks (Microsoft and NVIDIA) are more than 14% of the index – an all-time high. So much for diversification.
Note: Eli Lilly (LLY) fell back out of the top 10 at the end of August to number 12. Again, we aren’t going to replace it immediately because we want to minimize trading. We’ll consider replacing it after three consecutive months. As of today, if it were removed, it would be replaced by JP Morgan (JPM).
Looking at an updated technical analysis of the S&P 500 price chart, we see that the price has broken through the 123.6% Fibonacci retracement level, which I noted last month was not normally a level that I focus on, and is headed toward the more critical 138.2% level at $657. There really isn’t any resistance between here and there, and the market is neither overbought nor oversold. Both the 50-day and 200-day moving averages are rising. Absent a major catalyst, there is no reason to expect the index to do anything but continue grinding higher, despite its sky-high valuation using virtually any measure you like. The Buffett Indicator is good enough for Warren, and it is good enough for me.
Is there any wonder why Berkshire Hathaway is still a net seller of stocks even while already sitting on $344 billion of cash?
By the way, $344 billion is more than the market cap of 476 of the companies in the S&P 500!
US inflation data (CPI) for August will be released on Thursday morning. The CPI for July (released last month) increased 2.7% from July 2024, for the second month in a row. The average CPI since June 2024 has been 2.7%, nowhere near the Fed’s 2.0% target. I expect that we’ll see a moderate acceleration of inflation when it is released on Thursday morning. Yet, the futures market is currently betting on a 100% chance that the Fed is going to cut rates when they meet later this month.
What does the Fed's decision to cut interest rates in the face of high and accelerating inflation tell you about its view of the labor market? Hint: not good.
I know I probably sound like a broken record, but the Fed cutting interest rates does not mean that interest rates on 30-year mortgages, or even 2-year treasury notes, will follow suit.
As always, there is so much more I’d love to discuss, like Sam Altman calling AI a bubble or the MIT report concluding that 95% of enterprise AI fails, but I have hit the (already extended once) publishing deadline, and so I must leave it there for now!
I hope you found this commentary useful and ideally enjoyable too. Please tell me what you think - good, bad, or otherwise.
Would you recommend it to people you know? Why or why not? What about our portfolio management and financial planning services?
Click reply and let me know!
Until next time, I thank God for each of you, and I thank each of you for reading this commentary.
Clients, I encourage you to click here to access your personalized performance portal and see how your portfolio performed compared to the markets last month.

Shane Fleury, CFA
Chief Investment Officer
Elevate Capital Advisors
Legal Information and Disclosures
This commentary expresses the views of the author as of the date indicated and such views are subject to change without notice. Elevate Capital Advisors, LLC (“Elevate”) has no duty or obligation to update the information contained herein. This information is being made available for educational purposes only. Certain information contained herein concerning economic trends and performance is based on or derived from information provided by independent third-party sources. Elevate believes that the sources from which such information has been obtained are reliable; however, it cannot guarantee the accuracy of such information and has not independently verified the accuracy or completeness of such information or the assumptions on which such information is based. This memorandum, including the information contained herein, may not be copied, reproduced, republished, or posted in whole or in part, in any form without the prior written consent of Elevate. Further, wherever there exists the potential for profit there is also the risk of loss.